|
|
Agent-based Semiology for Simulation and Prediction of Contemporary Spatial Occupation Patterns,a paper that I had the pleasure to co-author with Mathias Fuchs, is our contribution to this year’s Design Modelling Symposium Berlin titled Impact: Design With All Senses. The conference proceedings have been published by Springer International Publishing and can be accessed here. This text is available here in accordance with the publishing rights granted to Springer strictly for non-comercial internal, academic and research purposes only Please do not copy or distribute.
Agent-based Semiology for Simulation and Prediction of Contemporary Spatial Occupation Patters
Mathias Fuchs and Robert R. Neumayr
Abstract. Agent-based semiology is a powerful simulation and prediction environment for pedestrian simulation that allows for accurate balancing of complexity. Here, we describe a framework to simulate increasing behavioural interactivity between agents via agent-based modeling, together with a statistical approach to make the results amenable to a quantitative and automated analysis. That approach borrows ideas from crowd simulation and spatial statistics, notably fitting of Poisson processes, and computer graphics. The described process can simply be thought of as that of approaching an observed pattern by an overlay or additive mixture of grey-scale images each of which are distance transforms of physical objects. Thus, we describe the observed pattern in terms of interactions of spatial features which are akin to traditional BIM tags. We thus arrive at a remarkably concise prediction of the simulation outcome. The benefits of this simulation speedup is, on the one hand, to allow for higher optimization throughput, and on the other hand, to provide designers with quantitative feedback about the impact of their design on the simulation outcome.
Keywords: Parametric Modeling, Simulation, Agent-Based Semiology.
Introduction
Agent-based Semiology aims to investigate, analyze, simulate, and predict contemporary spatial occupation patterns in social spaces in order to understand and develop the performance criteria that interactively link these spaces, their interiors, and their users. The research ambition at hand is to develop a cross-disciplinary method of architectural design that generates spatial environments with high social performativity.
Architecture channels its social processes through semiological associations as much as through physical separation and connection. It functions through its visual appearance, its legibility and its related capacity to frame its users’ communication. In that way the built environment is not just physically directing bodies, it is orienting socialized agents who have to understand and navigate complex spatial organisations, or “As a communicative frame, a designed space is itself a premise for all communications that take place within its boundaries.” [21].
In a conventional design process, the designer tends to intuitively adapt and spontaneously intervene within the historically evolving semiological system of his respective cultural environment. The aim of agent-based semiology, however, is to move from this intuitive participation within an evolving semiosis towards a systematic and explicit design process, that understands contemporary spatial organisations as coherent systems of signification without relying on the familiar codes found in the existing built environment.
In today’s networked society and its communication-based working patterns, its increasingly open and dynamic environments, complex spaces and multi-layered social systems of use, the users’ behavioural patterns of interaction cease to be linear and simple to predict but rather start to show emergent and unpredictable properties. This emerging behavioural complexity is no longer a clear function of a number of static spatial occupation patterns, but the result of an iterative process in which the repeated superimposition of a set of comparatively simple interaction patterns of a system’s basic components (its agents) adds up to the complex state of the emergent system. Such nonlinear process, in which small-scale interactions govern a systems overall configuration, is called a “bottom-up” process, as opposed to a “top-down” process, in which the overall form is determined first in order to subsequently organize its constituent parts.
The results of these kind of processes can no longer be calculated or predicted and present serious challenges for predictive algorithms, suggesting the use of extensive computer simulations of its underlying dynamics. They can, however, be simulated using agent-based modeling which is commonly defined as “a computational method that enables a researcher [to] experiment with models composed of agents that interact within an environment.” [7]. In, 1987 Craig Reynolds was the first to successfully set up such a simulation, reproducing the flocking behaviour of birds with this simulation program “Boids” [19]. Since then agent-based models (ABM) have been developed, refined and commonly used for simulations in the fields of physics, chemistry, biology, or social sciences, mapping the processes that we assume to exist in a real social environment [15].
While other tools and techniques for understanding social spaces, such as for example Space Syntax [10] have gained considerable popularity over the years, architecture has only recently discovered the use of agent-based models for the simulation of life processes. Similar to flocks of birds or schools of fish, human crowds show complex non-linear behaviour and thus constitute emergent systems, that can be successfully simulated by agent-based modeling. Therefore this research proposes their use for the simulation of architecture-related life processes.
The analysis and prediction of emergent spatial occupation patterns in today’s social spaces, most notably contemporary office environments, has gathered more attention recently, as the economies of developed countries increasingly depend on the free flow of information rather than on the administration and exchange of goods and services. In Western European countries knowledge economy at this point represents about a third of all economic activities [6].
Moving away from long-established Taylorist office space layouts with its traditional linear logics of mono-directional workflow, where the success of different spatial layouts could be easily measured, work patterns in today’s knowledge economy has become increasingly complex, flexible, and interwoven and can therefore no longer be organized and evaluated according to Taylorist principles. Consequently, new methods of assessing the performance of spatial layouts need to be developed.
Designers such as the German Quickborner team with their Bürolandschaft concept, started already in the 1970s to develop novel office layouts that were essentially real-life diagram-spaces based on the optimization of spatial relations between groups of employees. While this design methodology was still relying on the assumption, that there is a linear relationship between a spatial layout’s organisational efficiency and its work output, one of its major innovation was that it focused on the patterns of communication rather than its contents, thus establishing the flow of information as a generative tool. The other key innovation was the abolishment of spatial hierarchies in order to foster informal communication which was considered critical in a cybernetic organisational model [14], or as Quickborner’s Ottomar Gottschalk put it: “Informal conversations are not only useful – in all likelihood they are actually crucial.” [8].
In knowledge economies employees increase their respective radius of interaction due to the intrinsically networked nature of contemporary workflow and as a consequence various new types of knowledge work with their particular needs and mobility patterns emerge [9]. The sharing of work, goods or products is less important than information interchange, communication, and human interaction. A space’s performativity therefore largely hinges on its capacity to spatially and semiologically frame the constant informal and formal transfer of knowledge between its users in various different configurations.
Therefore, a design brief of a contemporary office environment acts as an experimental setup in which empirical and statistical knowledge, simulation methodologies, and design ideas are systematically brought together. In order to measure the various emergent patterns that arise from the agents’ continuous interactions with each other, as well as with their environment, the research focuses on the office space’s breakout space, which is its most informal area, where spontaneous communicative encounters and unscheduled opportunities for networking, collaboration and skill exchange can easily occur. At the same time the space’s furniture elements also allow for planned or organized meetings or conferences of various sizes and configurations.
Simulation methods and ACL – scenario matrix
The research sets up and refines agent based life process simulations, in which the semiological code is defined in terms of the agents’ behavioral rules or scripts being triggered by specific environmental features as well as by the interaction with other agents. The simulation is run in two independent programs in parallel, NetLogo and Unity, with the same setup and variable values, in order to be able to compare results and data.
NetLogo (see Fig. 1) is a program designed for agent-based simulations with built-in processes that already solve typical agent based simulation scripting problems. As it is purely code based it is fast, scalable and data extraction is easy.
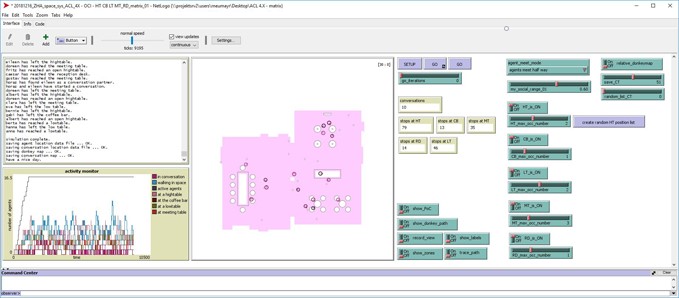 Fig. 1. The Netlogo simulation environment. Fig. 1. The Netlogo simulation environment.
Unity is a component based software program, that is very popular amongst game developers used to develop multiplayer video games across various platforms. Its complexity allows for sophisticated agent interactions and can also be fully script driven.
In order to understand, simulate and predict comprehensive life-like office scenarios with complex behavioral patterns within a controlled simulation, a clearly defined small-scale office breakout space is used to script and test relationships between agents and the environment. The task is the development of a population of agents with life‐like individual behavioral rules that allow for the emergence of a simplified, yet overall plausible collective event scenario. For this, any agent population needs to display two key properties of ‘life‐process modeling’.
First of all, there needs to be agent differentiation by status, affiliation, or position within the social network, implying behavioral difference as agents interact with each other. Real-life social interactions are complex in nature, as they depend on multiple variables, that have to be effectively weighted to be made operational in a simulation. While this research has been looking into using social network analysis to extract relevant social network features (for example from email databases) to later inform agent-based life process modeling, at this point agents’ behaviour, such as probability and duration of interaction, is driven by randomly assigned accumulative interaction values. Agent will choose to interact with the agent agent, who has the highest interaction value within a fixed range of values that who is available (i.e. not occupied) within a defined distance.
Secondly there needs to be architectural frame‐dependency, implying different behavioral patterns depending on location and spatial architectural qualities. To that end, architectural features, which are typical for an office break out space, such as different types of tables, a reception desk, or a coffee machine, are added to the simulation environment, once the basic logic is set up. These features are assigned interaction values similar to the agents, that govern the agents’ interaction with them.
Like in other strands of design research, continuously refining the digital processes becomes an important issue once a basic logic is established[16]. Therefore the complexity of the simulation is increased continuously, step by step. While the simplest movement pattern in spatial simulation is the random walk [17], the initial simulation setup is an agent walking around the scene unaware of his surroundings.
Simulations gradually increase in complexity and for better systematic comparison are organized in a 2-dimensional matrix system. On the vertical axis we define the agent complexity (agent capacity level – ACL), starting from the simplest possible agent as described above (ACL 1.0). In each subsequent step, the agents’ capabilities are systematically extended (i.e. collision detection, agent interaction, object interaction, etc.), up to a simplified office setup that allows for agent to agent interaction as well as for an interaction with a number of common furniture elements, such as a reception desk, a coffee machine, high tables, low tables, and a meeting table. The result is an accumulative build up of potential agent faculties that allows for direct comparison of individual ACLs and therefor speculation on possible success criteria and relevance of agent capacities.
On the horizontal axis, each capacity level is tested in four parallel simulation scenarios (A, B, C, D) in order to produce a more robust data set. These scenario differ slightly from each other in terms of their floor pan layout, the location of doors, and the position of interaction objects. The parameters that remain constant are a maximum number of 16 agents per simulation and the total run time of 30 min. During runtime relevant data, such as the agent’s positions, their encounters and interactions, is constantly collected from the simulation and stored for later analysis. For ease of comparison the data is used to create a number of visual quantifiers, such as heat map showing the concentration of occupancy (density) and trail maps tracking the movement of each individual agent.
The collected simulation data from the first three simulations (A, B, and C) is used to train a prediction algorithm that finally is tested against the empirical data set of the last simulation (D) for accuracy, where the prediction algorithm is confronted with a novel scenario condition.
Statistical description and prediction
Overview and goal
Gaining an approach to a statistical description is necessary for bridging the gap between pedestrian simulations on one side, and 3D modeling. We aim at automating the knowledge transfer in an objective and repeatable way, by deriving a sufficiently general model of the interaction between people and their environment. We emphasise a quantitative, interpretable, easily trained algorithm inspired from statistical learning, that is adaptive and easily extrapolated to new scenarios, in order to leverage the potential of pedestrian simulation for real-world design.
Spatial data analysis [4] deals with regressing observed movement patterns on spatial features. Whereas in a usual linear regression model, the values taken by a single dependent variable are explained by relating them to a linear combination of the independent variables, the so-called features, in a spatial data analysis task an entire spatial field of observations is related to a linear combination of independent feature fields. For instance, the dependent field could be that of successful oil rigs, and the independent fields could be the maps of geographical and geological characteristics. Here, the dependent field is given by the observed pedestrian movement pattern, and the independent feature fields are given by explanatory physical or architectural features of the space. Then, observations of a linear combination of the dependent variables blurred with Gaussian noise.
Figures 2 and 3 demonstrate the inspiration visually: to bridge the gap between hard geometrical features and smooth pedestrian behaviours.
 Fig. 2. The discrepancy between “hard” geometry and “soft” pedestrian movement patterns can be bridged tentatively by assuming the existence of a guiding principle that steers the pedestrian density according to the proximity to the geometrical pattern. In this work, we are formalising the idea of describing the observed pedestrian density as an overlay of proximities to hard geometrical or physical features of the space. Fig. 2. The discrepancy between “hard” geometry and “soft” pedestrian movement patterns can be bridged tentatively by assuming the existence of a guiding principle that steers the pedestrian density according to the proximity to the geometrical pattern. In this work, we are formalising the idea of describing the observed pedestrian density as an overlay of proximities to hard geometrical or physical features of the space.
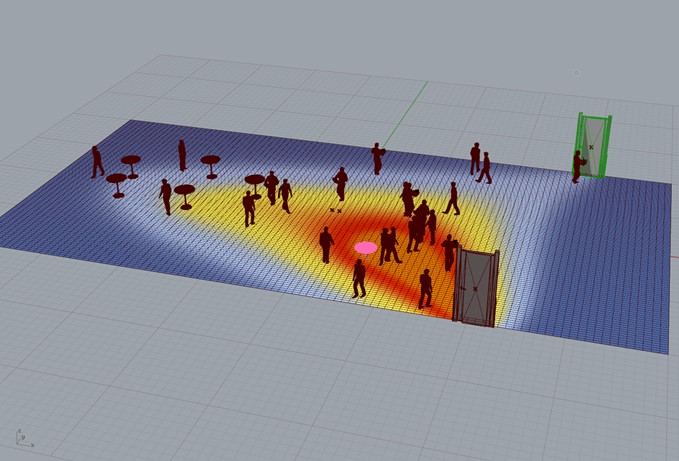 Fig. 3. A spatial pattern is assumed to be generated by input fields, generated by objects. Typically, doors and tables are the “seed crystals” of these fields. Fig. 3. A spatial pattern is assumed to be generated by input fields, generated by objects. Typically, doors and tables are the “seed crystals” of these fields.
Development of a statistical model
Therefore, we need to find a way to describe regressors or dependent variables. We used a notion of one-channel image, reflected in a C++ class, to capture the spatial impact of a feature in the form of its distance image [12]. A feature is a user-supplied “explanatory” function. Here, we use the distance fields from objects but in principle any kind of one-channel image can be used for the task. Such a function can be thought of as an gray-scale image, overlaid onto the 2d rectangle representing the scene’s bounding box in plane view. A typical function could represent the distance to a point of interest such as the central table in a meeting room. Thought of as an image, it consists of radial isolines around the table, getting darker and darker farther away from it. In a first step, one models the impacts of the most apparent spatial features, acting as attractors: doors, tables, toilets, staircases, maybe windows, etc. Their impact is modeled by a function which decreases steadily with higher distance to the object. In general, there is a variety of possible “influence maps”.
In concrete statistical terms, estimating the weights or contributions of each feature is done by fitting a Point Poisson Model to the Data with the Maximum Pseudolikelihood Method [3 and 9]. Fig. 4 shows the central object of study: the pedestrian density represented at as a heatmap. Concretely, the process can be thought of as first computing the empirically observed heatmap and then interpreting it as an overlay as pictured in Fig. 6 of distance images to these spatial features.
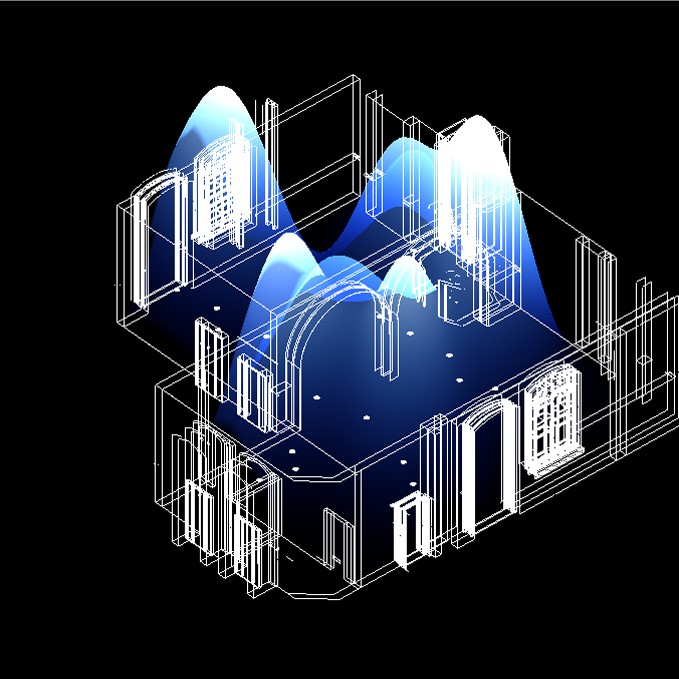 Fig. 4. The building block of statistical reinterpretation of the observed pedestrian occupation pattern is the heatmap. A small number of these is used to approach the observed one. This figure illustrates the complexity inherent in an observed heatmap. Moreover, the dependence of the visual appearance of the heatmap on the bandwidth used for its computation, is often underestimated. This phenomenon corresponds to the ubiquitous property of natural patterns to exhibit structure on every scale from small to large whereas artificial patterns are often constrained to fewer scales. Fig. 4. The building block of statistical reinterpretation of the observed pedestrian occupation pattern is the heatmap. A small number of these is used to approach the observed one. This figure illustrates the complexity inherent in an observed heatmap. Moreover, the dependence of the visual appearance of the heatmap on the bandwidth used for its computation, is often underestimated. This phenomenon corresponds to the ubiquitous property of natural patterns to exhibit structure on every scale from small to large whereas artificial patterns are often constrained to fewer scales.
Attaching features to physical objects and statistical model fitting
The aim of statistical analysis is twofold: fostering the understanding of the spatial process by descriptive processing, and the extrapolation of the learned model to new scenarios in a prediction. In this second step, we derive a way to draw the density of pedestrian activity, as generated in a simulation, onto the design canvas in an adaptive manner. We accomplish that goal by employing techniques and algorithms from point processes. In particular, we show how rudimentary BIM (building information model) tag information gives rise canonically to a set of spatial features. We then go on to describe how a Poisson model fitting gives rise to a statistical model which associates to a design intervention a smooth (“parametric”) adaptation of the predicted pedestrian density. See [20] for an overview of density estimation and its relationship with Gaussian blurring, and the subsection below for the exact description of the fitting method of the features. Fig. 4 shows the central object of study: the pedestrian density represented at as a heatmap.
We validate the generated predictive model by careful separation of the data into disjoint learning and testing sets. A particular benefit of the method is its susceptibility to produce not just predictions — as, for instance, a neural network would — but instead to generate an understanding of how the model works, by yielding concrete and interpretable coefficients associated with the spatial features.See Fig. 7 for an example of prediction results on ACL 4.4.
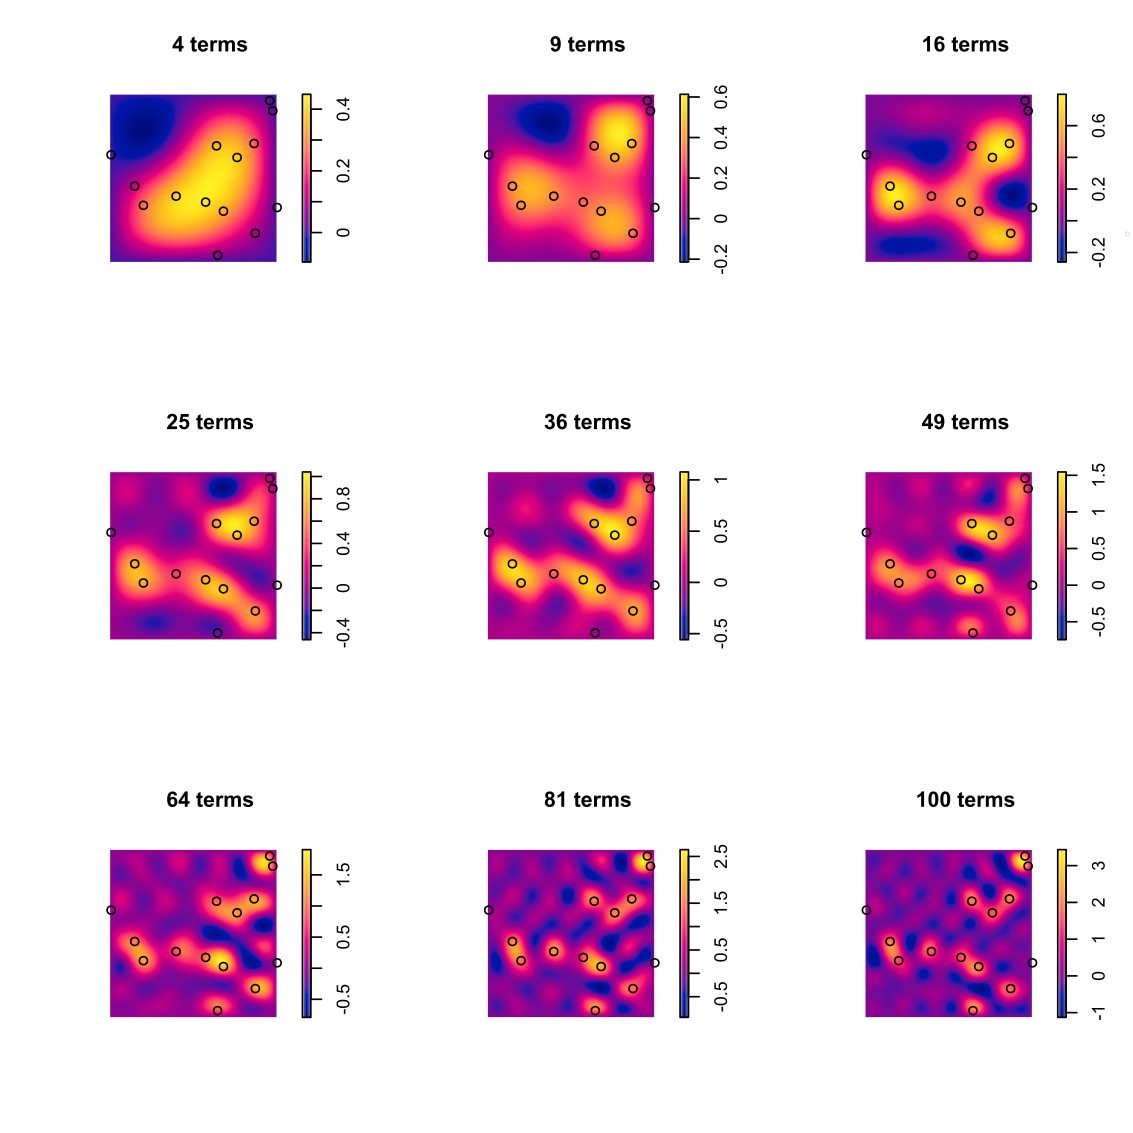 Fig. 5. The concept of reinterpreting and observed pattern in terms of an overlay of simpler ones is quite powerful. Here, we show how any uniform random point pattern, i.e. a noise pattern, can be described almost perfectly as an overlay of generic heatmaps – sine waves in this case. The approximation principle is closely related to consequences of the theory of Fourier series. Fig. 5. The concept of reinterpreting and observed pattern in terms of an overlay of simpler ones is quite powerful. Here, we show how any uniform random point pattern, i.e. a noise pattern, can be described almost perfectly as an overlay of generic heatmaps – sine waves in this case. The approximation principle is closely related to consequences of the theory of Fourier series.
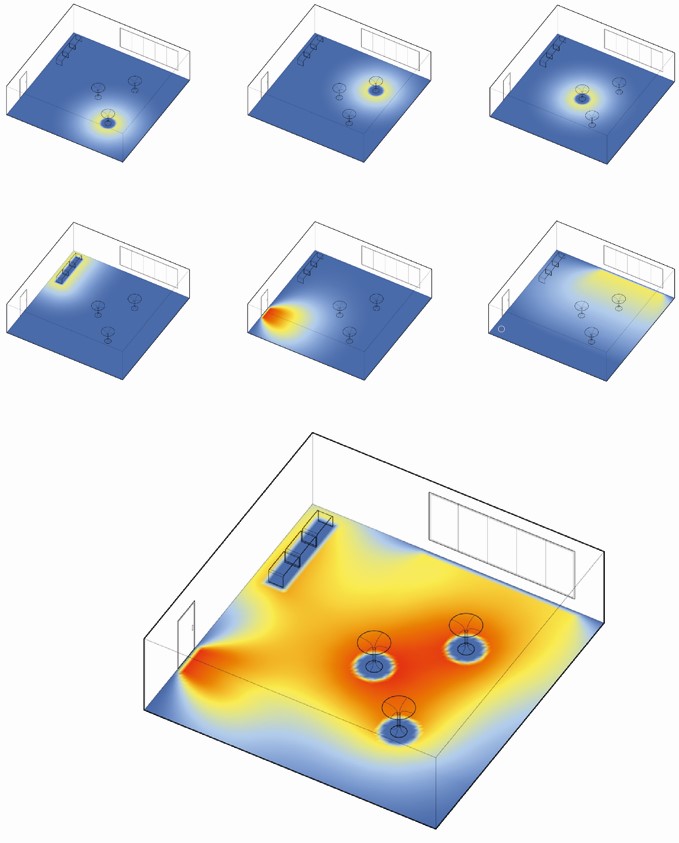
Fig. 6. Each spatial object generates its distance transform. Here, six types of objects – door, window, three standing tables and a desk, each generate a distance function. Finally, these are overlaid additively to generate a statistical re-interpretation of an observed pedestrian pattern. The process of fitting the parameters of a Poisson process described here is the one that determines the contributions or weights of each single such feature image to the overlay.
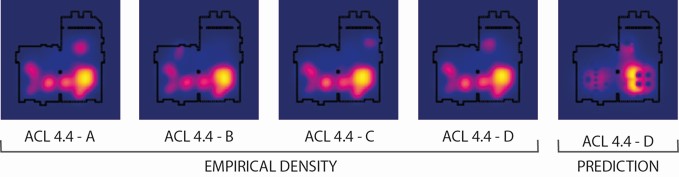 Fig. 7. Result of the prediction. Learning sets are A to B, true observed pattern is D. Fig. 7. Result of the prediction. Learning sets are A to B, true observed pattern is D.
Description of the fitting algorithm
The actual core of the method is the computation of the weights of each single image — typically, a distance image. Each weight gives the image’s relative contribution to the overlay which is intended to be describe the output pattern given by the observed pedestrian locations, as closely as possible. The relevant sub-discipline of statistics is that of spatial data [3], and in particular that of spatial point patterns [5]. To simplify matters, a spatial point pattern can, in that context, just be thought of as a finite collection of two-dimensional points. We use the R system of statistical programming [18], and in particular the popular package “spatstat” for spatial statistics [2].
The translation of our geometrical problem into the language of spatial statistics is very straightforward: The locations immediately define a spatial point process, and each distance image defines a spatial function and thereby a covariate (or independent variable as in the more classical context of usual univariate regression). We interpret the latter locations as a spatial point process and these weights by fitting a point process model to the observed point pattern with the “ppm” method of the spatstat R package. This function, in turn estimates the weights or contributions of each feature by fitting a Point Poisson Model to the Data with the Maximum Pseudolikelihood Method [1 and 11].The function yields a fitted model, and each covariate’s coefficient is interpreted as the desired weight. Note that this method is superior to the naive way of performing a pixel-wise linear regression because it takes the evident correlations between pixels into account. We use the “Poisson” interaction model [13] of the ppm function which is a simplification because it is the simplest model and already yields meaningful results. Additionally, we integrate a slight non-linearity into the fitting process by taking interaction terms up to cubic order into account.
Generalisability
It should be noted the goal of the prediction is not simply to be as accurate as possible. Indeed, greater accuracy can always be achieved at the expense of generalisability: Learning more about a particular constrained design task comes at the cost of giving up the applicability to a more general design language. On the other hand, a general learned model can not adapt to the particularities of a special situation.
Here, we have chosen to confine the study to a particular space, so that we have been leaning on the side of accuracy. See Fig. 5 for a demonstration of an arbitrarily good fit of the given data. Input fields are sine waves, and the overlay or superposition corresponds to the terms of a Fourier series converging against a limit in Hilbert space. Here, we generated a random spatial pattern and have demonstrated extreme “overfitting” by approaching that pattern to a stunning degree, taking a large number of terms into account. On the other hand that illustration shows the power and flexibility of the simple overlay approach. Therefore, in an architectural context, the question of overfitting remains salient, imposing a strong trade-off between prediction accuracy and generalisability.
Limitations and drawbacks
While the simulation’s taxonomy, scripts and results as well as the developed prediction algorithms yield very promising results, the office space layout initially chosen for the simulation setup starts to show certain restriction and limitations. Although size and program of the simulation setup were intentionally kept quite confined in the beginning in order to better control the overall simulation and its results, later on this decision proved to be increasingly limiting.
The prediction’s accuracy increases with each additional object and feature included in the simulation, however, the small scale of the simulation space sets a clear limit to the overall number of one-channel images that can be meaningfully implemented. Not only does the intended use as an office breakout space restrict the types of possible objects and features, the size of the chosen office simulation space also sets a physical limit to maximum number of objects such a space can purposively hold. The next stage of this research will therefore seek to expand the scope of the simulation space, adding an additional office program as well as more one-channel images.
Regarding the geometric-statistical method, a possible drawback is that it does not apply immediately to optimization because on the one hand it only predicts densities which are by definition relative (their integral is one). Another drawback is that it is unclear how to determine which classes of layouts a prediction generalizes to. Thus, it would be desirable to identify either geometric, architectural or maybe even socio-cultural traits of a space which should be treated as being within the prediction scope of the algorithm.
Summary
We have described a unique approach borrowing insights and techniques from architecture, agent-based modeling, statistics of point processes, and computer graphics into a novel framework for semiological interpretation and prediction of contemporary spatial occupation patterns. The methodology introduced in this research is tailored towards measuring and simulating the social phenomena that stem from our increasingly complex built environment.
In total, we have shown that a simple process of overlaying spatial features corresponds to the statistical process of fitting the parameters of a Poisson process.
Outlook
The proposed statistical method can be described as “quantitative semiology” and has, as such, a vast field of possible applications in architecture and urbanism.
The first logical step consists in applying an optimization engine like for instance an evolutionary algorithm to exploit the prediction for “machine design”: one extracts from the predicted density a success measure linked to the functionality of the space or the architecturally desired functional outcome. It could be defined by the amount of conversations, or by their comprehensiveness, or by some measure of the receptiveness of the design, etc. Then, a density prediction leads to a prediction of that particular chosen measure. From that point on, it lends itself to consider a larger number of possible designs or even an entire parametrized family, and to relate the outcome – the success measure – directly to these parameters. There are straightforward parameters such as sizes, distances and other quantities of geometric provenience, as well as well-studied design parameters coming, for instance, from the space syntax grammar [10]. In general, however, it becomes necessary for actual optimisation to assign some “space DNA” quantities to each proposed design. The more insightful these parameters are chosen, the more likely is the success of a machine learning strategy for associating the social functionality. Hence, one will be in a position to ask for prediction and optimization of the success of an entire design family. For this, it would be helpful to have better design measures and fitness criteria. In particular, the question about insightful and parsimonious design parameters that are suited to describe a design’s functionality remains to be answered in an interdisciplinary approach.
There is an ample spectrum of possible future research possibilities. In particular, it will be worthwhile to exploit exploitation of the more realistic 3d features of a Unity simulation, and pose the question how the agents’ behavior is influenced by their field of vision, possibly to be described in combination with an evolutionary algorithm. In the end, one will learn much more about the complexity of pedestrian behavioral patterns and their interaction with the surrounding space.
References
[1] Berman, M. and Turner, T.R. Approximating point process likelihoods with GLIM. Applied Statistics 41 31–38 (1992).
[2] Baddeley, A., Rubak, E. and Turner, R. (2015). Spatial Point Patterns: Methodology and Applications with R. Chapman and Hall/CRC Press (2015)
[3] Cressie, N., Statistics for spatial data. John Wiley and Sons, Inc (1993).
[4] Daley, D.J., Vere-Jones: An Introduction to the Theory of Point Processes. Volume I: Elementary Theory and Methods. Springer (2003).
[5] Diggle, P.J.: Statistical Analysis of Spatial Point Patterns. Arnold, London, second edition (2003)
[6] Eurostat: Science,Technology and Innovation in Europe. Luxembourg: Publication Office of the European Union, p. 115. (2013).
[7] Gilbert, N.: Agent-Based Models. Thousand Oaks: Sage Publications Inc., p. 2. (2008).
[8] Gottschalk, O., Architekt of the Quickborner Teams, Symposium “Bürolandschaft” at the documenta 12 in Kassel. (2007).
[9] Greene, C. and Myerson, J.: Space for Thought: Designing for Knowledge Workers. In Facilities, Vol. 29 Issue: 1/2, pp.19-30, (2011).
[10] Hillier, B. and Hanson, J.: The Social Logic of Space. Cambridge: Cambridge University Press. (2003).
[11] Jensen, J.L. and Moeller, M.: Pseudolikelihood for exponential familymodels of spatial point processes. Annals of Applied Probability 1 445–461 (1991).
[12] R. Kimmel and A.M. Bruckstein, “Distance maps and weighted distance transforms,” in Proceedings SPIE-Geometric Methods in Computer Vision II, San Diego (1996).
[13] Kingman, J. F. C.: Poisson Processes. Clarendon Press (1992)
[14] Kockelkorn, A.: Bürolandschaft – eine vergessene Reformstrategie der deutschen Nachkriegsmoderne. In ARCH+ Zeitschrift für Architektur und Städtebau, Vol. 186/187 (2008).
[15] Macy, M. and Willner, R.: From factors to actors: Computational sociology and agent-based modeling. In Annual Review of Sociology, 28, pp. 143-166. (2002)
[16] Neumayr, R. and Budig, M.: Generative Processes – Script Based Design Research in Contemporary Teaching Practice. In Paoletti, I. (Ed.), Innovative Design and Construction Technologies. Milano: Maggioli S.p.A., p. 172. (2009).
[17] O’Sullivan, D. and Perry, G.: Spatial Simulation. Exploring Pattern and Process. Chichester: Wiley-Blackwell, pp. 97-131. (2013).
[18] R Core Team: R: A language and environment for statistical computing. R Foundation for Statistical Computing, Vienna.
[19] Reynolds, C.: Flocks, herds, and schools: A distributed behavioral model. In: Proceedings of the 14th Annual Conference on Computer Graphics and Interactive Techniques ACM. 21 (4), pp. 25–34. (1987).
[20] Silverman, B.W.: Density Estimation for Statistics and Data Analysis, In: Monographs on Statistics and Applied Probability, London (1986).
[21] Schumacher, P.: Advanced Social Functionality Via Agent-Based Parametric Semiology. In: Schumacher, P. (Ed.), Parametricism 2.0. AD 02/2016. London: Wiley, p. 110 (2016).
Tags: 2019, angewandte, architecture, architektur, article, conference, design as research, design modelling symposium, design modelling symposium berlin 2019, dmsb 2019, fwf, impact: design with all senses, innovative design and construction technologies, mathias fuchs, media, neumayr, paper, parametric design, parametric semiology, parametricism, peek, publication, research, rneumayr, robert neumayr, robert r. neumayr, rrneumayr, semiology, uak, writings
|